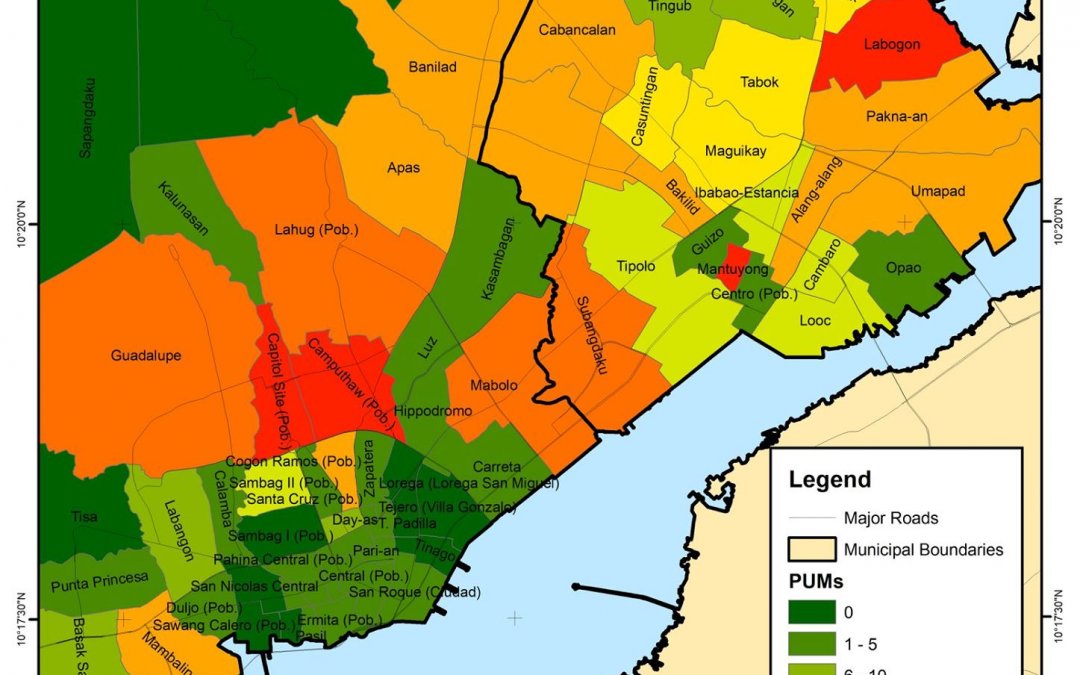
CENVI creates heat maps of COVID-19 cases in Cebu Province.
Local government units may contact CENVI for assistance in preparing similar maps at [email protected].
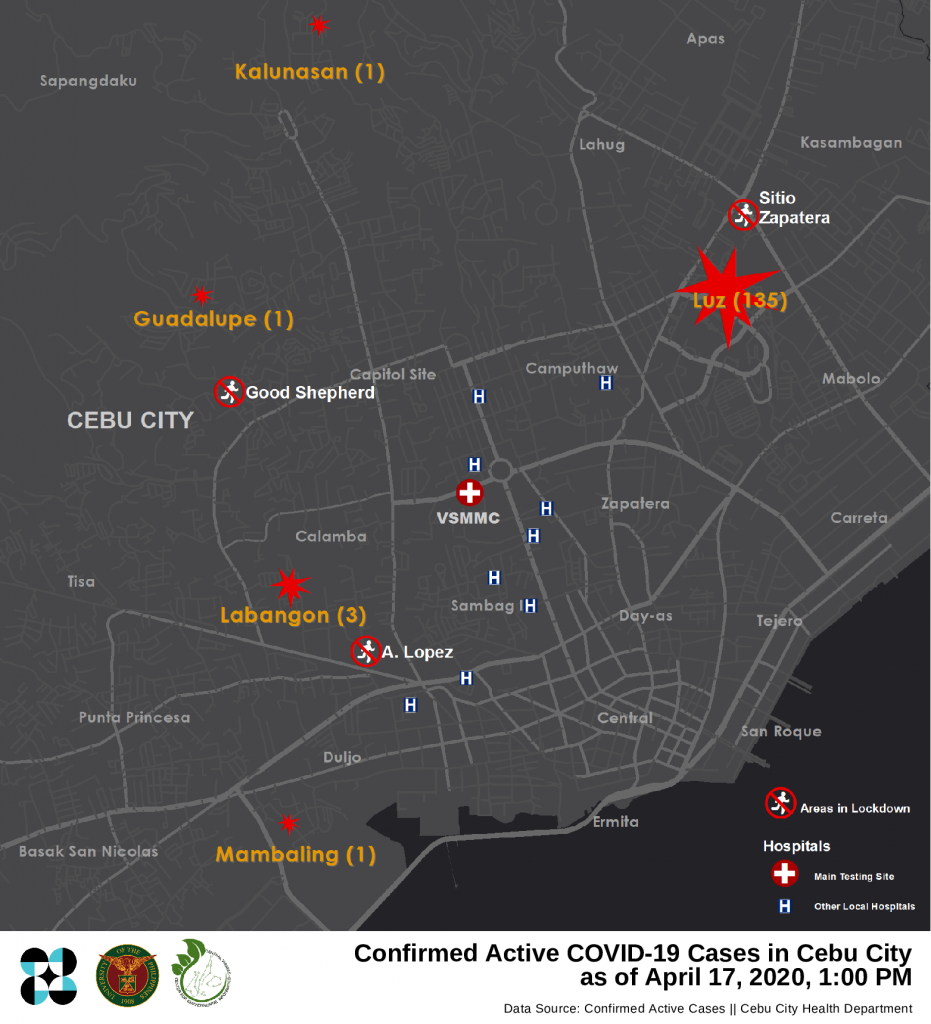
UPDATE. A map of confirmed active cases of COVID-19 in Cebu City. Pin size is directly related to the number of confirmed cases in affected barangays.
As of writing, these are the following barangays with confirmed active COVID-19 cases:
Bo. Luz || 135
Guadalupe || 1
Kalunasan (Opra) || 1
Mambaling || 1
Labangon || 3
Maps are based on publicly available data from the Cebu City Health Department as of 1:00 PM, April 17, 2020. Additional information and/or corrections are most welcome.
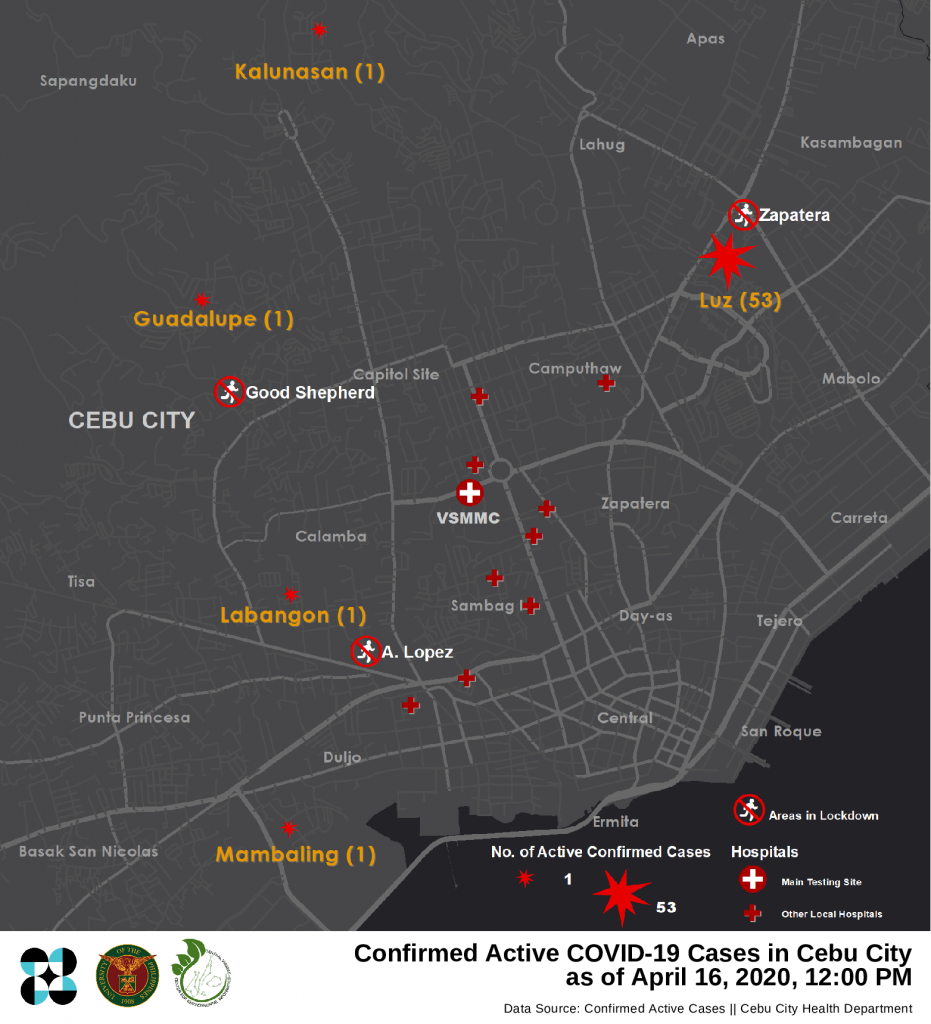
A map of confirmed active cases of COVID-19 in Cebu City. Pin size is directly related to the number of confirmed cases in affected barangays.
Maps are based on publicly available data from the Cebu City Health Department as of 12:00 NN, April 16, 2020. Additional information and/or corrections are most welcome.
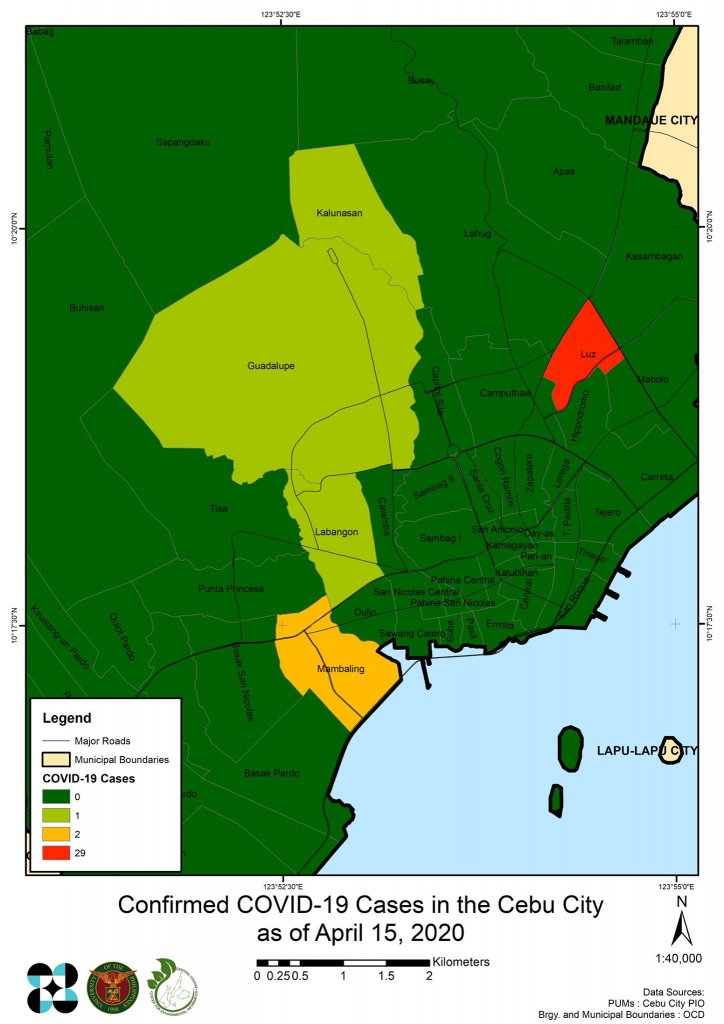
A heat map for CONFIRMED ACTIVE cases of COVID-19 in Cebu City as of April 15, 2020.
As of writing, these are the following barangays with confirmed active COVID-19 cases:
Bo. Luz || 29
Guadalupe || 1
Kalunasan || 1
Mambaling || 2
Labangon || 1
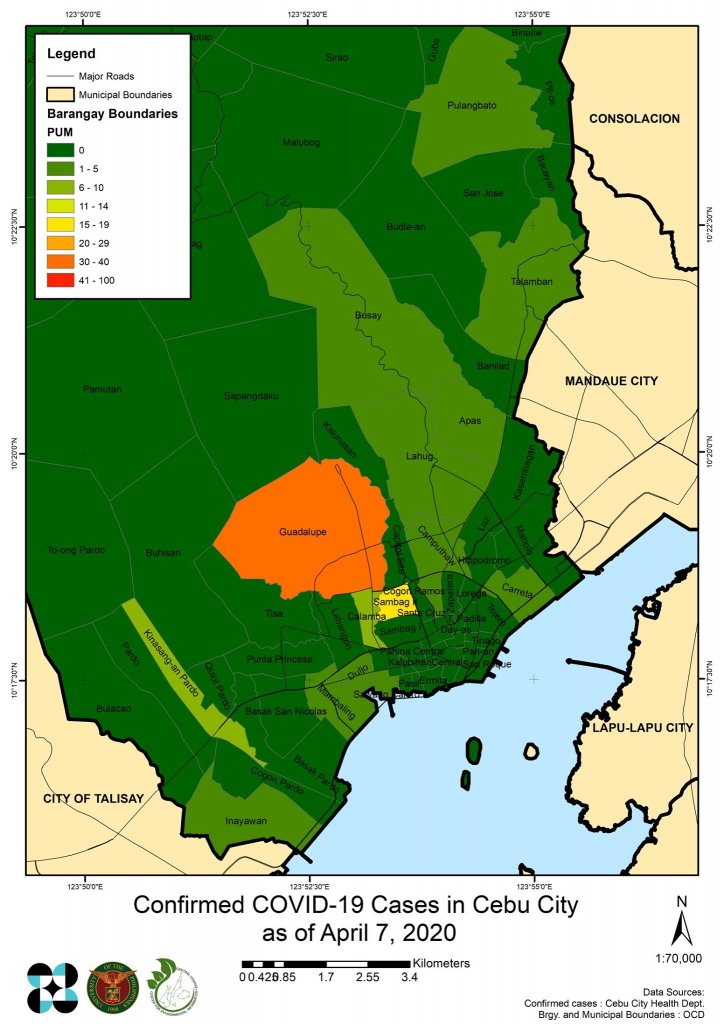
Updated heat map of PUMs as of April 7, 2020 in Cebu City
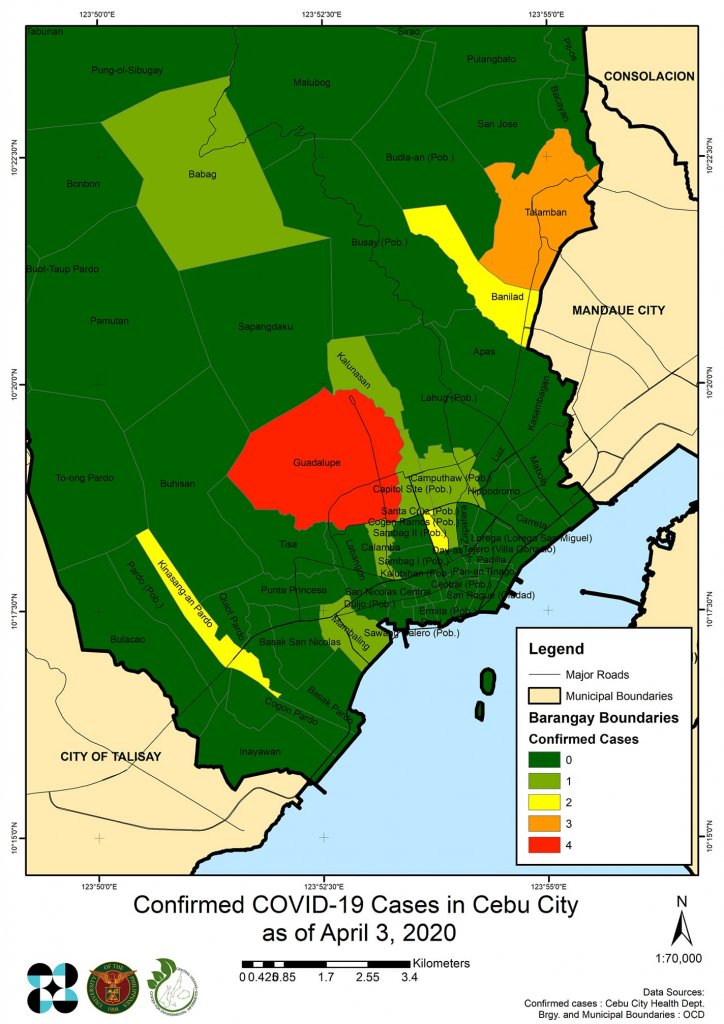
A heat map of confirmed COVID-19 cases as of April 3, 2020 in Cebu City
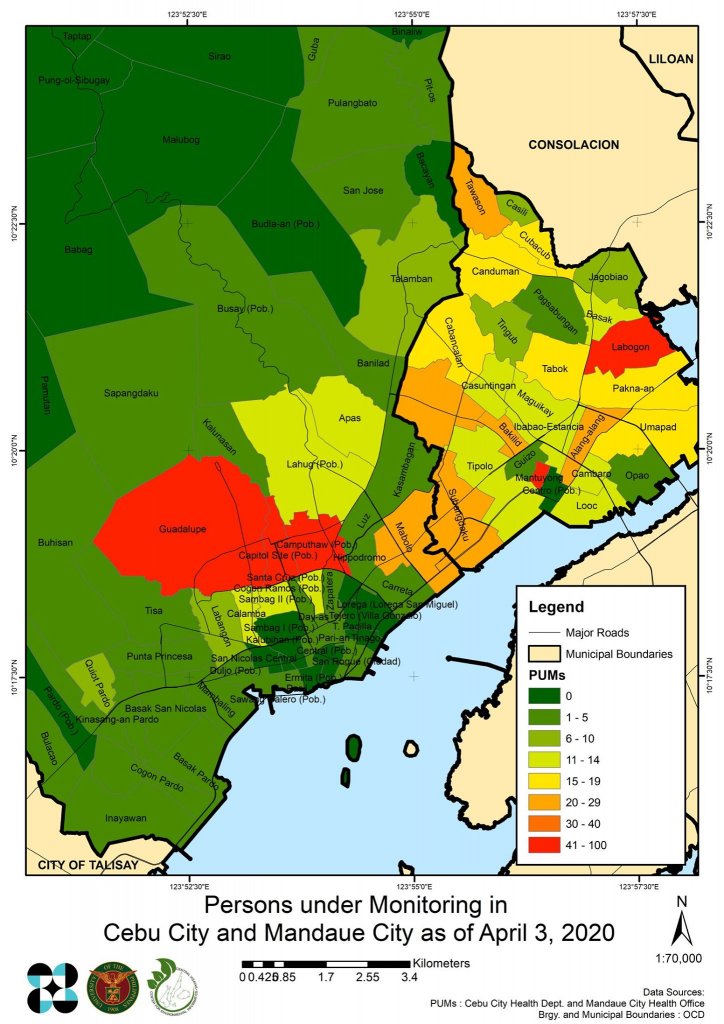
A heat map of PUMs as of April 3, 2020 in Cebu City and Mandaue City
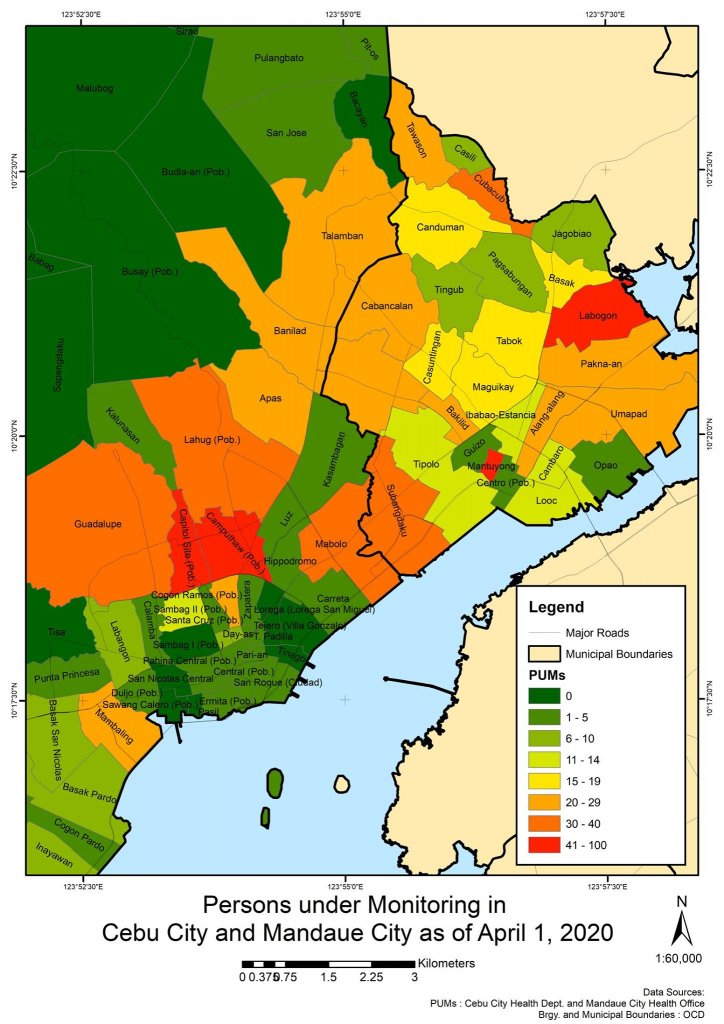
CENVI produces this heat map showing the PUM distribution in the cities of Cebu and Mandaue.

